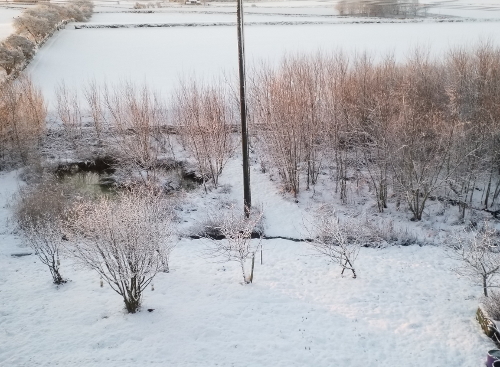
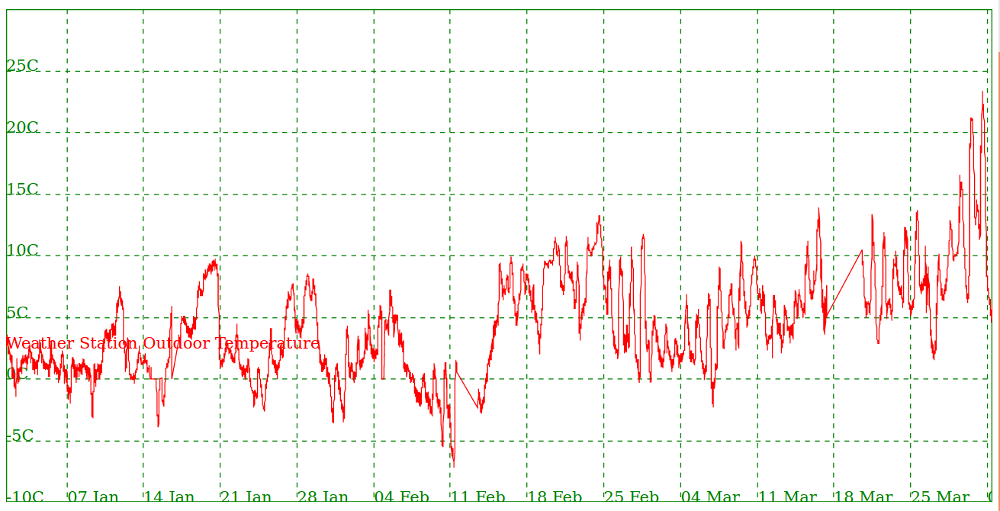
The first 3 months of 2021, 90 days in all, have been very interesting weather-wise, here in West Yorkshire. The temperature graph for these 90 days looks like this:
Of those 90 days, we had:
- 30 days of predominantly sunny weather
- 21 days of overcast skies
- 16 days of rain
- 12 days of snow
- 5 days of storm
- 3 days of high winds
- 3 days of fog
[I define stormy days as a combination of high winds and lashing precipitation (either rain or snow).]
This data has come as a bit of a surprise, as I my impression of the same period in previous years is of cloudy skies and rain, lashing rain, or drizzle. We have even had prolonged and heavy snowfall in late March, notably in 2012, when were were cut off from the outside world for a week! So this year, with its 30 days of sunshine, has altered my perceptions of my environment.
January saw a few warm(ish) days, but on the whole it was cold, with only 7 days of sunshine. February, normally relentlessly wet and miserable, surprised us with warmer sunnier days towards the end of the month, reaching a high of 13.25° on the 24th. March started with three days of thick fog and ended with a mini-heatwave (23°!).

The fancy clip-on markers in the image above mark the end of each month, the small calabash pins mark every 10 days as a reminder of my progress.
Every month, I blog about my progress with this project here on the Granary Knits website; I would love to see examples of other knitters’ temperature blankets, so please post photos on Twitter using hashtag #TempPi2021.